


Biogeographical Ancestry
Genetic Genealogy

Biogeographical ancestry (BGA) is now the preferred and more accurate term for what DNA testing companies have traditionally called "ethnicity." Another commonly used term is BioAncestry.
Until recently, genetic genealogists—including myself—referred to these findings as "ethnicity results." To align with current terminology, I am updating this blog with the preferred terms and sharing my latest results.
The five most popular DNA testing sites for ancestry and health insights are AncestryDNA, 23andMe, MyHeritage DNA, FamilyTreeDNA, and Living DNA.
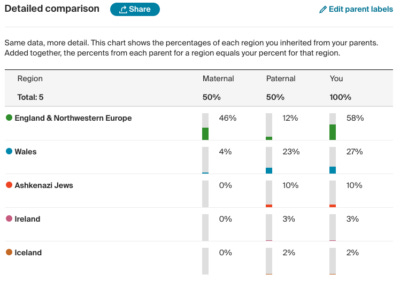
Ancestry's most recent BGA update was in July 2024, and my results align well with my documented family history.
I was especially pleased to see the West Midlands highlighted, as this is where most of my maternal ancestors lived in recent centuries. The Welsh ancestry reflects both my paternal and maternal heritage, while the 10% Ashkenazi Jewish matches what I would expect from my great-grandfather.
The 3% Irish may be linked to either my Scottish or West Welsh ancestors, but the Icelandic component appears to be an anomaly—I suspect it will disappear in the next update.
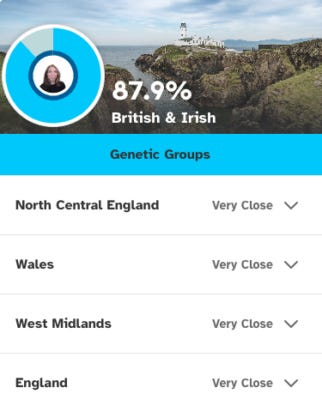
Like Ancestry, 23andMe has accurately highlighted my West Midlands heritage. Even better, it identifies my mitochondrial haplogroup as T2b, which aligns with my known ancestry.
23andMe categorizes my Ancestral Composition as European, further dividing it into Northwestern European and Ashkenazi Jewish, with percentages that match my documented family history.

One advantage of 23andMe is its detailed regional breakdown beyond just the West Midlands. It identifies four distinct British regions in my ancestry:
North Central England
Defined as “north central England and parts of the West Midlands, including Staffordshire, Leicestershire, West Midlands, Cheshire, and Derbyshire.”
Common maternal haplogroups: H1, T2b, and H1c.
Since my maternal haplogroup is T2b, this fits well with my ancestry.
Wales
Defined as “Wales and England’s Welsh border counties,” which includes parts of the West Midlands.
Common maternal haplogroups: J1, H1, and T2b.
Again, T2b is listed, reinforcing my maternal connection to this region.
West Midlands
Defined as "Shropshire, Staffordshire, Worcestershire, Herefordshire, and Warwickshire," though most people in this genetic group have ancestry near Birmingham.
Common maternal haplogroups: J1b1a, R0, and H1.
Interestingly, T2b is not listed here, even though my maternal line is from the West Midlands as far back as I have traced. However, since T2b appears in both the North Central England and Wales groups, it suggests my maternal ancestors may have been in this broader area for centuries. More research is needed!
England & Southern Uplands of Scotland
This category covers all of England and parts of upland Scotland.
Common maternal haplogroups: U5a1a1, H5a1, and H1b.
On my paternal side, my Ashkenazi Jewish ancestry does not come from my Y-DNA line but from a different paternal branch. We know that my 2x great-grandfather, Abraham Israel, came from Poland, and our family has strong ancestral ties to Ukraine. These results fit well with what we know so far.

MyHeritage has once again accurately identified my European origins, while also providing a more detailed breakdown of my Ashkenazi ancestry.
MyHeritage claims to offer the most diverse and detailed Jewish ethnicity analysis available, with five Jewish ethnic groups and 55 Genetic Groups of Jewish origin.
European Breakdown
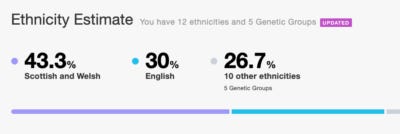
My results show:
43.3% Scottish & Welsh
30.0% English
This seems reasonable, especially if the Welsh category includes some of my West Midlands ancestry. However, I find it odd that Scottish and Welsh are grouped together.
The biggest surprise in this update is the unexpected appearance of:
6.5% Breton
5.1% Dutch
These results seem questionable, and I suspect they may disappear in future updates.
Ashkenazi Jewish Breakdown
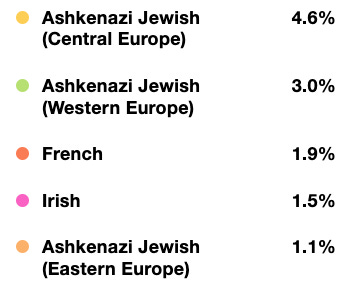
Unlike other testing companies, MyHeritage provides a more nuanced interpretation of my Jewish ancestry, dividing it into:
4.6% Ashkenazi Jewish (Central Europe)
3.0% Ashkenazi Jewish (Western Europe)
1.1% Ashkenazi Jewish (Eastern Europe)
This level of detail helps clarify regional origins within my Ashkenazi lineage, which aligns with what I know about my family's history.
My FamilyTreeDNA myOrigins® Version 3 Results
Here’s a look at my latest myOrigins® Version 3 results from FamilyTreeDNA. As expected, my ancestry is 100% European, but the breakdown offers some different results from the other testing companies.
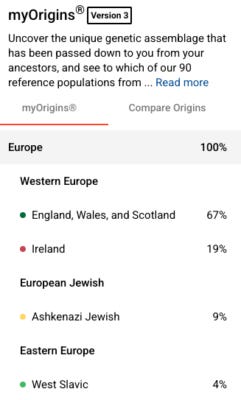
Western European Ancestry
England, Wales, and Scotland – 67%
Ireland – 19%
This aligns well with my known family history. The grouping of England, Wales, and Scotland together makes it harder to pinpoint specifics, but given my strong West Midlands roots, I assume much of this percentage is from that region. The 19% Irish is also intriguing—it could be linked to either my Scottish or West Welsh ancestors, though more research is needed to confirm.
European Jewish Ancestry
Ashkenazi Jewish – 9%
This fits closely with what I already know about my Ashkenazi Jewish heritage, which comes from my great-grandfather’s line. It’s interesting to see this as a single category here, whereas other testing companies sometimes divide Ashkenazi ancestry into more specific regions.
Eastern European Ancestry
West Slavic – 4%
This is an interesting addition. My Ashkenazi Jewish ancestors had strong Polish and Ukrainian ties, so it makes sense that a Slavic percentage appears in my results. It would be interesting to see if this changes in future updates.
Overall, these results are a good match for my documented genealogy, though the broad regional groupings leave some room for interpretation. It will be interesting to compare this with future updates and results from other DNA testing companies!
My Living DNA results provide a detailed breakdown of my British and Irish heritage, with 88% of my ancestry linked to regions across Great Britain and Ireland. Unlike some other testing companies, Living DNA offers a more regionalized view, identifying specific areas where my ancestors may have lived.
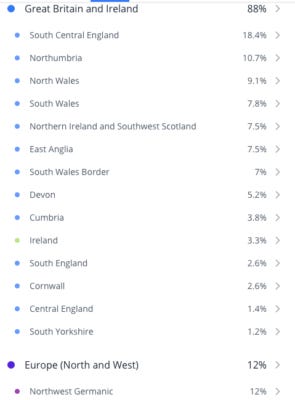
British Isles Breakdown
The largest proportion of my ancestry is from South Central England (18.4%), which aligns with my known family history. There are also notable contributions from Northumbria (10.7%), North Wales (9.1%), and South Wales (7.8%), suggesting a mix of English and Welsh ancestry. The Northumbrian doesn't fit with documented research nor the results from other companies, but the Welsh is more accurate.
Other regions appearing in smaller percentages include:
Devon (5.2%) and Cornwall (2.6%), possibly indicating connections to the West Country.
Cumbria (3.8%), which may be linked to the English-Scottish border region.
South Yorkshire (1.2%), a relatively small proportion but still notable.
No Jewish ancestry has been identified in this breakdown, despite its appearance in results from other companies. It is unclear where it is.
Germanic Ancestry
Unlike previous tests, Living DNA has identified a 12% Northwest Germanic component. Could this be connected to the missing Ashkenazi ancestry? Or could it reflect historical migration into Britain, possibly from Anglo-Saxon or Viking populations>
Conclusions
Overall, my updated BGA results offer a detailed view of my British ancestry, highlighting multiple regional connections and providing valuable insights into broader ancestral patterns. However, there is still room for improvement, and I look forward to future updates.
Interesting to see the slight variations in the results from each different testing company. These will become ever more accurate over time and it will be interesting to see how the regions and accuracy develop
As I'm particularly interested in language and usage changes, in terms of the change in terms, who is it that has standardized the terms to be used and does their decision govern all the DNA testing platforms?